在雅思写作考试中,图表小作文(Task 1)是评估考生描述、总结信息能力的关键部分,对于许多目标分数为6.5分的考生而言,掌握其核心写作逻辑与规范,往往比追求复杂词汇更为有效,一篇合格的6.5分范文,不仅在于数据陈述,更在于清晰的结构、准确的比较与流畅的逻辑推进。
理解评分标准:6.5分的核心要求
雅思写作Task 1的评分基于四项标准:任务完成情况、连贯与衔接、词汇资源、语法范围及准确性,6.5分属于“合格使用者”中的较好水平,具体要求如下:
- 任务完成: 能够清晰概述图表的主要趋势、差异或阶段,并涵盖关键特征与数据,无需所有细节。
- 连贯与衔接: 信息安排有逻辑性,分段合理,能有效使用衔接手段,但可能存在些许重复或机械使用。
- 词汇: 词汇量足以讨论图表主题,能尝试使用一些不常见词汇,可能存在用词不准确,但不影响理解。
- 语法: 能混合使用简单句和复杂句,语法和标点错误存在但不影响信息传递。
备考重点并非堆砌生僻词,而是构建一个清晰、准确、逻辑自洽的描述框架。
结构框架:四段式经典布局
一篇结构清晰的图表作文,通常遵循以下四段式布局,这是确保逻辑连贯的基础。
第一段:引言(Introduction) 用1-2句话改写题目,关键在于使用同义替换和句式转换,切忌照抄题目,将“The chart shows”替换为“The graph illustrates”、“The diagram provides information on”等。
第二段:概述(Overview) 这是获取高分的关键段落,需在开头明确呈现,用2-3句话概括图表中最显著、最重要的整体趋势、模式或结论,无需提及具体数据,最高值、最低值、总体上升或下降、显著对比等。
第三、四段:主体段落(Body Paragraphs) 将图表信息进行逻辑分组,分两段进行详细描述,分组方式取决于图表类型:
- 动态图(随时间变化): 可按趋势分组(如一段写上升项目,一段写下降或波动项目),或按时间段分组。
- 静态图(某一时间点对比): 可按数值大小分组(如一段写数值高的类别,一段写数值低的类别),或按相似性分组。
- 流程图或地图: 严格按阶段或区域的空间/顺序逻辑描述。 描述中需准确引用关键数据(如峰值、谷值、转折点),并进行有效比较。
语言精粹:提升表达准确性与多样性
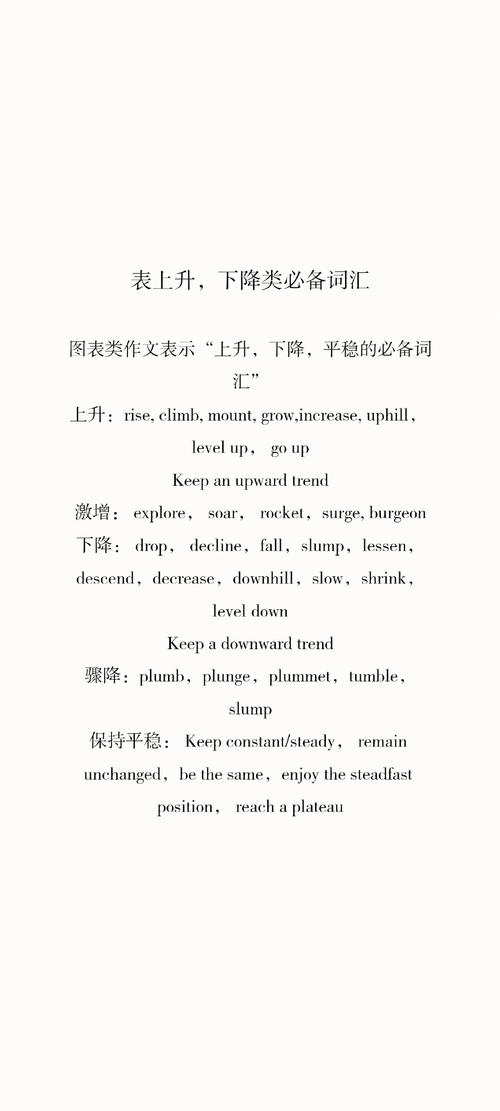
趋势描述词汇
- 上升: Increase, rise, grow, climb, go up,可用副词修饰:steadily(稳定地), significantly(显著地), sharply(急剧地)。
- 下降: Decrease, decline, fall, drop, go down,副词:gradually(逐渐地), slightly(轻微地), dramatically(剧烈地)。
- 波动: Fluctuate, vary。
- 稳定: Remain stable/steady, level off, stabilize。
- 达到顶点/底点: Reach a peak of, peak at; Hit a low of, bottom out at。
数据引用与比较
- 精确使用介词:by(表示变化幅度),to(表示最终值),at(表示具体数值点)。
- 例:The figure rose by 20% to 50% in 2010.
- 善用比较级、最高级以及“while”、“whereas”、“compared to”、“in contrast to”等连接结构,突出对比。
句式多样性 避免通篇“主语+动词+数据”的简单句,尝试使用:
- 分词结构:Starting at 10%, the number then climbed steadily.
- 定语从句:The period, which saw the most dramatic growth, was between 1990 and 2000.
- 状语从句:Although consumption declined initially, it recovered by the end of the period.
5分范文示例与解析
以下是一篇针对动态线图的范文示例,目标分数为6.5分。 ** The graph below shows the consumption of three types of fast food in the UK from 1970 to 1990. Summarise the information by selecting and reporting the main features, and make comparisons where relevant.
范文:
The line graph illustrates the changes in the annual consumption of hamburgers, fish and chips, and pizza in the United Kingdom over a twenty-year period, from 1970 to 1990. Units are measured in grams per person per week.
Overall, it is clear that hamburgers and pizza saw a rise in their popularity over the period shown, while the consumption of fish and chips fluctuated and ultimately declined. By 1990, hamburgers had become the most consumed fast food item.
In 1970, fish and chips were the most popular food, with consumption standing at approximately 90 grams per person per week. This figure experienced significant fluctuations, reaching a peak of around 100 grams in 1985 before dropping sharply to about 55 grams by the end of the period.
In contrast, the consumption of hamburgers and pizza showed upward trends, though from different starting points. Pizza consumption began at just 10 grams in 1970 and increased gradually to 40 grams in 1980. Its growth accelerated after 1985, finishing at around 70 grams in 1990. Hamburger consumption started higher, at 30 grams in 1970, and rose steadily throughout the period. It surpassed fish and chips around 1983 and continued to climb, reaching a high of nearly 110 grams per person per week in 1990, making it the most popular item.
解析:
- 引言段: 成功改写了题目,涵盖了“what”、“where”、“when”。
- 概述段: 明确点出两大核心趋势:汉堡和披萨上升,炸鱼薯条波动下降;并指出最终状态(汉堡成为第一),这是获取6.5分的关键段落。
- 主体段落: 逻辑清晰地将炸鱼薯条(趋势独特)分为一段,将汉堡和披萨(同为上升趋势)分为另一段进行对比描述,有效引用了关键数据(起点、终点、峰值、交叉点),并使用了“in contrast”、“though”等衔接词。
- 语言: 使用了“illustrates”、“experienced significant fluctuations”、“surpassed”等恰当词汇,句式有变化,如分词结构“reaching a peak... before dropping...”,和状语从句“though from different starting points”,语法和词汇使用基本准确,符合6.5分水平。
实用备考建议
要稳定产出6.5分水平的图表作文,需要系统练习,养成动笔前花1-2分钟分析图表、确定概述要点和主体段落分组的习惯,坚持“先模仿,后创新”的原则,研读优质范文,积累其结构框架和常用表达,并应用到自己的写作中,务必重视反馈,完成写作后自行检查任务完成度、逻辑连贯性和语言错误,或寻求专业指导,针对性改进薄弱环节。
图表描述的本质是信息传递的清晰与效率,掌握其规范框架,并辅以准确的语言表达,远比追求华丽的辞藻更为重要,对于目标分数在6.5分的考生,扎实的结构、清晰的概述和有条理的数据描述,是通向成功最可靠的路径,坚持针对性练习,将这一格式内化为写作习惯,便能在考场上从容应对,稳定发挥。