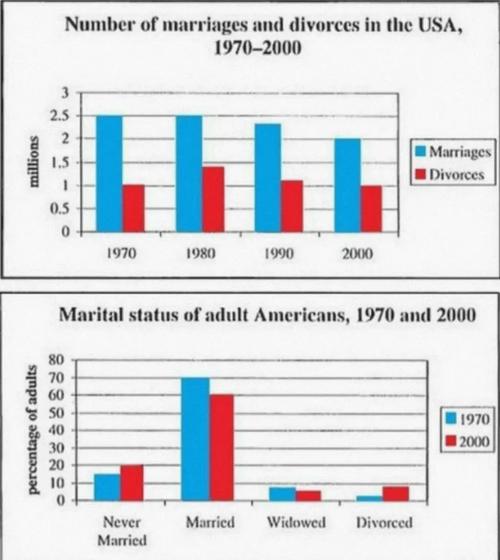
柱状图是一种常见的数据可视化工具,通过不同高度的矩形条来展示各类别数据的大小对比,广泛应用于学术报告、商业分析及学术写作中,在英文写作中,描述柱状图需遵循清晰、客观的原则,既要准确呈现数据特征,又要通过逻辑分析揭示数据背后的趋势或规律,以下将从柱状图的基本结构、描述步骤、常用表达及范文示例等方面展开详细说明,并附相关问答。
柱状图的基本结构与核心要素
柱状图通常包含三个核心部分:标题(Title)、坐标轴(Axes)和数据标签(Data Labels),标题概括图表主题,如“Global Smartphone Sales by Quarter in 2025”;横轴(X-axis)表示分类变量,如地区、时间段或产品类别;纵轴(Y-axis)表示数值变量,如销售额、数量或百分比;数据标签则直接标注每个柱状的具体数值,方便读者快速获取信息,部分图表会包含图例(Legend)以区分不同系列的数据(如多组柱状图对比),或单位标注(如单位为“百万美元”“%”等),描述时需先明确这些要素,确保读者对图表框架有清晰认知。
柱状图英文描述的步骤与技巧
描述柱状图需遵循“总-分-总”的逻辑结构,分为引言、主体分析和结论三部分。
引言部分:概述图表主题与时间范围
开头需点明图表反映的核心内容,避免细节堆砌。“The bar chart illustrates the changes in the number of international students enrolled in Canadian universities from 2025 to 2025.” 或 “As depicted in the bar chart, the market share of three major electric vehicle (EV) brands—Tesla, BYD, and NIO—in China was compared in 2025.”
主体分析:核心数据提取与对比
主体部分需聚焦关键数据,优先描述最高值、最低值、极值变化及显著趋势,可按“分类描述+对比分析”展开:
- 分类描述:逐一说明各柱状代表的数值,如“In 2025, the number of international students in Canada reached 630,000, a 15% increase from 2025.”
- 对比分析:通过比较不同类别或时间点的数据,揭示差异或关联。“Tesla’s market share (35%) was significantly higher than BYD’s (22%) and NIO’s (12%), while the latter two brands showed a marginal gap.”
- 趋势描述:若涉及时间序列,需说明变化方向(上升/下降/波动)及幅度。“The period from 2025 to 2025 witnessed a steady growth in student numbers, with an average annual increase of 8%, whereas a slight decline was observed in 2025 due to the pandemic.”
结论部分:总结核心发现或隐含意义
结论需基于数据提炼客观结论,避免主观臆断。“Overall, Canadian universities have become increasingly attractive to international students over the six-year period, reflecting the country’s efforts to promote global education.” 或 “It is evident that Tesla dominated the Chinese EV market in 2025, though competition from BYD suggests a potential shift in the industry landscape.”
常用表达与词汇参考
描述数据趋势
- 上升:increase/rise/grow/soar surge (from...to...) / a sharp/steady/modest increase
- 下降:decrease/drop/fall/decline/dip (by...) / a significant/gradual decline
- 波动:fluctuate/vary (between...and...) / experience ups and downs
- 持平:remain stable/level off / show little change
对比差异
- 超过:exceed/surpass/outnumber/be higher than
- 低于:be lower than/be less than/be inferior to
- 相似:be similar to/resemble/closely match
- 差距:the gap between...and... / A was twice as much as B / A accounted for 30%, while B constituted only 15%
数据准确性强调
- According to the chart... / The data shows that... / It is clear from the bar chart that... / Approximately/Roughly/Exactly...
范文示例(约400词)
The bar chart below presents the percentage of renewable energy (including solar, wind, and hydro) in the total energy consumption of five countries—Germany, Spain, the United States, China, and India—in 2025.
As is clearly shown, Germany led the group with renewable energy accounting for 46% of its total energy consumption, followed by Spain at 35%. The United States and China recorded moderate proportions, with 22% and 15% respectively, while India had the lowest share, standing at 8%.
Looking closer at the data, Germany and Spain demonstrated a strong commitment to renewable energy, likely driven by proactive environmental policies and favorable geographical conditions. For instance, Germany’s “Energiewende” (energy transition) policy has significantly boosted solar and wind energy adoption in recent years. In contrast, the United States, despite its large renewable energy capacity, still relied heavily on fossil fuels, contributing to its relatively lower percentage. China’s 15% share, though seemingly modest, was notable given its massive total energy demand; the country has been investing heavily in hydro and solar power to reduce carbon emissions. India, with its rapidly growing population and industrial sector, faced challenges in increasing renewable energy use, resulting in the smallest proportion among the five nations.
Overall, the chart reveals a clear disparity in renewable energy adoption across developed and developing nations. While European countries like Germany and Spain have made substantial progress, emerging economies such as India and China still need to accelerate their transition to cleaner energy sources to meet global climate goals.
相关问答(FAQs)
Q1: 在描述柱状图时,是否需要提及所有数据点?
A1: 不必提及所有数据点,否则会导致内容冗余,应优先选择关键数据,如最大值、最小值、变化显著的数据(如大幅增长或下降),以及体现整体趋势的数据(如平均值、总和),若图表包含10个国家的数据,可聚焦前3名、末位及具有代表性的中间数据,辅以“other countries ranged from X% to Y%”概括剩余信息,确保描述简洁且重点突出。
Q2: 如何区分“柱状图”与其他图表(如折线图、饼图)的英文表达及描述侧重点?
A2: 三者的英文表达及描述逻辑有明显区别:
- 柱状图(Bar Chart):用“bar(s)”表示,强调不同类别间的数值对比,描述时侧重“类别(X轴)vs 数值(Y轴)”,如“Sales of Product A were higher than Product B”。
- 折线图(Line Chart):用“line(s)”表示,侧重展示数据随时间或连续变量的变化趋势,描述时需关注“趋势方向(上升/下降)、波动幅度、拐点”,如“The number of users increased steadily from 2025 to 2025, before dropping sharply in 2025”。
- 饼图(Pie Chart):用“pie chart”或“circle graph”表示,反映整体中各部分的占比,描述时需突出“比例关系、最大/最小份额”,如“Held the largest share at 40%, while the remaining three categories accounted for 60% collectively”。
区分核心在于:柱状图比“差异”,折线图看“趋势”,饼图讲“占比”,描述时需围绕各自核心特征展开,避免混淆。