雅思线状图小作文是学术类写作任务一中常见的图表类型,主要考察考生对动态数据的描述、对比和分析能力,这类图表通常展示某个或多个指标在一段时间内的变化趋势,如增长、下降、波动或保持稳定等,考生需要通过准确的数据提取、合理的结构组织和清晰的语言表达,全面呈现图表信息,并突出关键特征,以下将从图表结构、核心要素、常用表达及注意事项等方面展开详细解析。
线状图小作文的基本结构与写作步骤
线状图小作文通常包含引言(Introduction)、主体段(Body Paragraphs)和结论(Conclusion)三部分,总字数建议控制在150-200词,但需根据题目要求灵活调整。
引言段:概述图表基本信息
引言段需简洁明了,包含图表类型、核心主题和时间范围,常用句式如:“The line graph illustrates the changes in [主题] over the period of [时间范围].” 或 “The provided line chart presents data regarding [主题] from [起始年份] to [结束年份].”
若图表描述“2000-2025年全球可再生能源消耗量变化”,引言可写:“The line graph illustrates the changes in global renewable energy consumption from 2000 to 2025.”
主体段:分层次描述数据特征
主体段是核心部分,需分段落呈现不同数据系列的变化趋势,避免信息堆砌,建议遵循“总-分”结构:先概括整体趋势,再具体描述关键数据点(峰值、谷值、转折点等)。
- 分段逻辑:若图表包含多条线(如多个国家/多个指标),按线分段;若为单线,按时间段或趋势类型(增长/下降/波动)分段。
- 数据选取:优先选择最具代表性的数据(如起点、终点、极值、显著变化点),避免罗列所有数据。
- 对比分析:若存在多条线,需对比不同系列间的差异(如“A国增速快于B国”“2025年X指标超过Y指标”)。
结论段:总结核心趋势
结论段无需重复具体数据,需提炼图表最突出的1-2个趋势,如“Overall, renewable energy consumption showed a significant upward trend during the period, with solar energy experiencing the most rapid growth.”
线状图的核心要素与常用表达
动态数据的描述
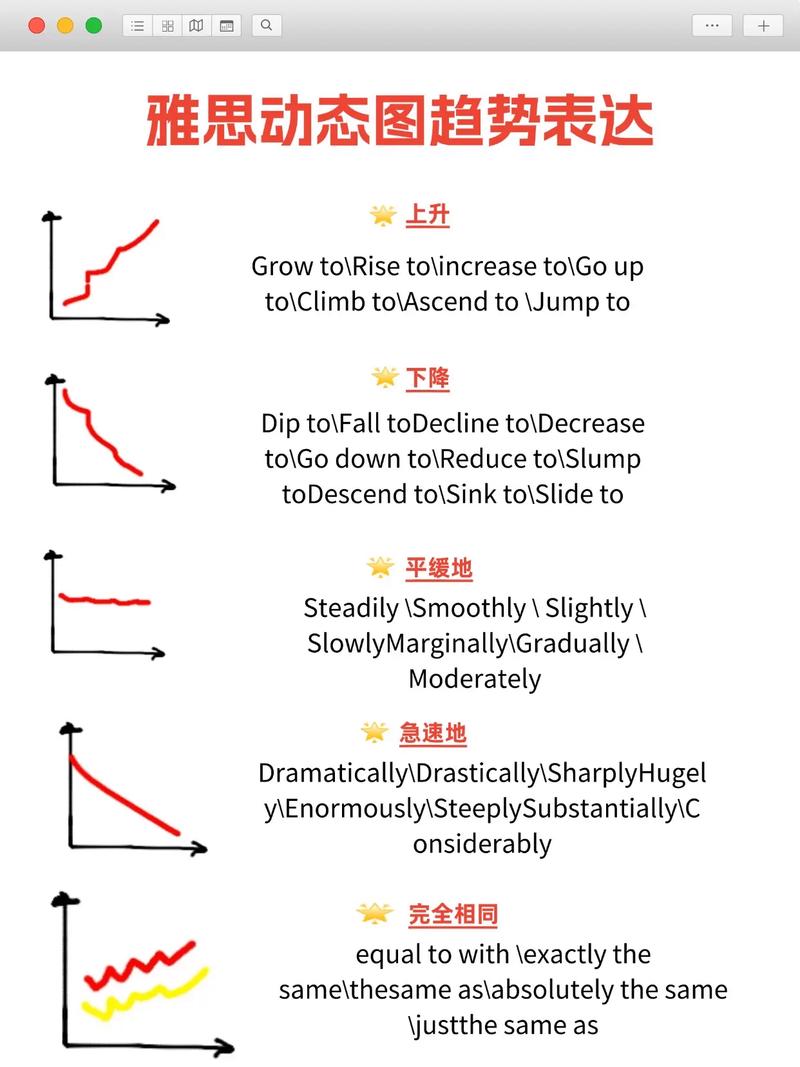
线状图的核心是“变化”,需准确使用动态词汇,区分不同变化程度:
| 变化类型 | 常用词汇 |
|---|---|
| 上升( gradual/slow) | increase, rise, grow, climb, go up, ascend |
| 上升( rapid/sharp) | surge, soar, jump, leap, rocket, shoot up |
| 下降( gradual/slow) | decrease, decline, drop, fall, reduce, dip |
| 下降( rapid/sharp) | plummet, crash, plunge, slump, tumble |
| 波动 | fluctuate, vary, oscillate, go up and down |
| 保持稳定 | stabilize, remain constant, stay steady, level off |
| 达到峰值/谷值 | peak at / reach a peak of...; hit a low / bottom out at... |
例如描述“2010-2025年太阳能消耗量从10单位增至50单位”: “Solar energy consumption experienced a sharp increase, rising from 10 units in 2010 to 50 units in 2025.”
数据对比与关联
当图表包含多条线时,需使用对比连词突出差异:
- 相同趋势:Similarly, Likewise, In the same way, A also followed a similar trend.
- 相反趋势:In contrast, On the other hand, Conversely, while A increased, B decreased.
- 倍数/差异:Twice as much as... / Three times higher than... / A significant gap was observed between...
例如对比A国和B国的增长率: “While the renewable energy consumption in Country A surged from 20 to 80 units, Country B showed a modest growth, increasing from 15 to 30 units during the same period.”
时间与数据的衔接
合理使用时间状语和数据引导词,使描述逻辑清晰:
- 时间顺序:From [年份] to [年份]... / Between [年份] and [年份]... / In the [时间段] (e.g., early 2000s, mid-2010s)...
- 数据引导:At... / In... / By... / The figure reached... / It stood at...
“In 2000, the consumption of wind energy was 15 units, which doubled to 30 units by 2010.”
线状图小作文的注意事项
- 避免主观臆断:仅基于图表数据描述,不添加外部信息或个人观点。
- 数据准确性:确保引用的数值、年份与图表一致,尤其注意单位(单位、百分比等)。
- 时态统一:描述过去数据用一般过去时(e.g., increased, reached);若图表含预测数据,未来趋势用一般将来时(e.g., is expected to rise)。
- 句式多样性:避免重复使用主谓宾结构,可适当使用分词结构(e.g., “Showing a steady increase, the figure reached...”)、从句(e.g., “which witnessed a sharp rise in...”)等。
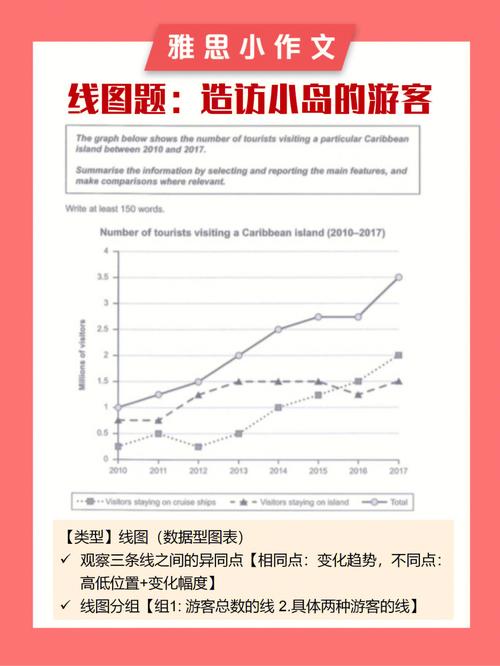
线状图小作文范文示例 The line graph below shows the number of overseas visitors to a certain country from 2010 to 2025.
范文:
The line graph illustrates the changes in the number of overseas visitors to a specific country over the decade from 2010 to 2025. Overall, the number of visitors experienced a general upward trend, with a notable fluctuation between 2025 and 2025.
In 2010, the country attracted approximately 10 million overseas visitors. Over the next five years, this figure grew steadily, reaching 15 million by 2025. However, between 2025 and 2025, the number of visitors declined sharply, dropping to 8 million in 2025, which was the lowest point during the period. This decrease was likely attributed to external factors such as travel restrictions or economic downturns.
From 2025 onwards, the recovery was significant, with the number of visitors rebounding to 12 million in 2025 and further surging to 18 million in 2025, surpassing the previous peak in 2025. The data suggests that despite temporary setbacks, the country remained an attractive destination for overseas travelers over the long term.
相关问答FAQs
Q1: 线状图小作文是否需要将所有数据点都写进去?
A1: 不需要,线状图的核心是“趋势”而非“数据罗列”,应优先选取关键数据点,如起点、终点、峰值、谷值以及显著变化点(如急剧上升/下降的转折处),若图表显示某数据从2010-2025年整体增长,但2025年出现短暂下降,需重点描述2010年、2025年、2025年的数值及变化趋势,而中间平稳年份可概括为“remained relatively stable”或“showed a slight increase”。
Q2: 如何区分线状图与柱状图的小作文写法?
A2: 两者的核心差异在于“动态”与“静态”的侧重:线状图强调“变化趋势”(需使用动态词汇如increase, fluctuate),而柱状图侧重“数据对比”(需突出不同类别间的数值差异,如higher than, lower than),线状图的时间轴通常为连续的(如年份、月份),适合描述长期趋势;柱状图的时间或类别可能为离散的(如不同国家、不同产品),适合对比特定时间点的数据,写作时,线状图需注意趋势的连贯性(如“先上升后下降”),柱状图则需关注横向或纵向的对比关系。