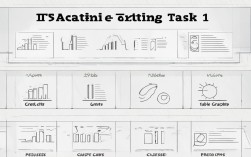
雅思写作考试中,数据描述是Task 1的核心要求之一,无论是饼图、表格还是其他图表,考生都需要准确、清晰地呈现数据,同时展现逻辑性和语言多样性,本文将探讨如何结合饼图和表格提升雅思作文质量,并提供实用写作技巧。

饼图与表格的写作特点
饼图(Pie Chart)和表格(Table)在雅思写作中各有侧重:
- 饼图:适合展示比例关系,突出整体与部分的对比。
- 表格:适合呈现具体数值,便于横向或纵向比较。
在考试中,有时会遇到混合图表(如饼图+表格),这时需要灵活运用不同的描述方式,避免重复表达。

数据描述的常用句型
1 饼图常用表达
- 比例描述:
- "The largest proportion is accounted for by A, at 35%."
- "B constitutes a mere 10%, making it the smallest segment."
- 对比变化:
- "While A dominates the chart, B and C remain relatively minor."
- "The share of D has increased by 5% compared to the previous year."
2 表格常用表达
- 数据比较:
- "The figure for X is significantly higher than that of Y (50 vs. 20)."
- "In contrast, Z shows a steady decline from 2010 to 2020."
- 趋势总结:
- "Overall, the data indicates a growing preference for renewable energy."
- "The table reveals clear disparities between urban and rural areas."
如何结合饼图和表格写作
同时提供饼图和表格,建议采用以下结构:
Introduction):简要说明图表类型及主要内容。
2. 饼图分析(Pie Chart Analysis):重点描述比例关系。
3. 表格分析(Table Analysis):提取关键数据进行比较。
4. Summary)**:归纳主要趋势或差异。
示例段落:
"The pie chart illustrates the distribution of energy sources in a country, with fossil fuels representing 60% of total consumption. Meanwhile, the table provides detailed figures for renewable energy adoption across three regions. Notably, Region A leads in solar power usage at 25%, whereas Region B relies more heavily on wind energy (40%)."

避免常见错误
- 数据误读:确保数字和百分比准确对应。
- 过度描述:不必列出所有数据,选择关键信息即可。
- 句式单一:交替使用主动语态、被动语态及不同句型。
提升写作质量的技巧
1 使用恰当的连接词
- 对比:However, In contrast, On the other hand
- 补充:Moreover, Additionally, Furthermore
- Overall, In summary, To conclude
2 词汇多样性
避免重复使用"show"或"illustrate",可替换为:
- Indicate, Reveal, Demonstrate
- Display, Present, Depict
3 适当使用复杂句
将简单句合并为复合句,提升语言层次:

- "The consumption of coal dropped sharply. This was due to stricter environmental policies."
→ "The consumption of coal dropped sharply due to stricter environmental policies."
实战练习建议
- 限时训练:20分钟内完成一篇Task 1作文。
- 范文分析:研究高分范文的结构和用词。
- 数据归纳:练习从图表中快速提取核心信息。
在雅思写作中,饼图和表格的熟练运用能显著提升分数,通过精准的数据描述、清晰的逻辑结构和丰富的语言表达,考生可以展现更强的分析能力,多练习、多反思,写作水平自然会稳步提高。