雅思饼图作文是学术类(A类)小作文中常见的图表类型,主要考察考生对数据的描述、比较和归纳能力,饼图通过圆形内扇形的大小比例展示整体与部分的关系,核心在于“占比分析”和“关键特征提炼”,以下从题型特点、写作结构、词汇运用、注意事项及实例解析五个方面展开详细讲解。
题型特点与审题要点
饼图作文的核心任务是“用文字还原图表数据”,需关注三个关键信息:整体数据(总量/基数)、部分占比(百分比/比例)、部分间关系(大小对比、差异排序),审题时需注意:
- 与单位:明确图表反映的主题(如“2025年某国能源消耗结构”)及数据单位(百分比、数量等),避免描述时偏离主题。
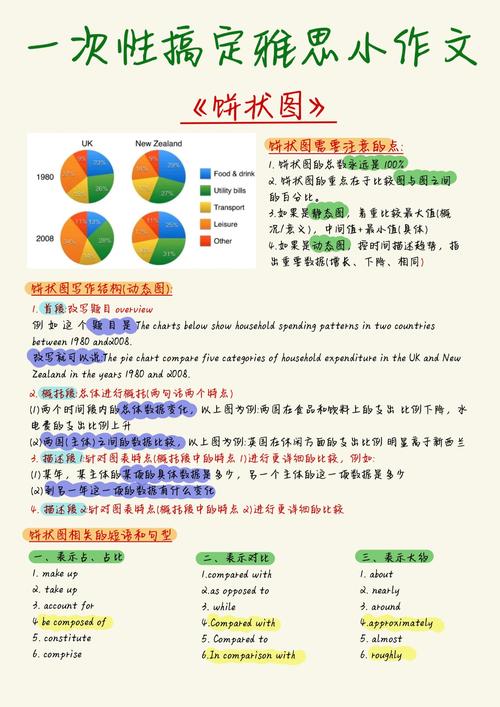
- 数据数量:若饼图包含2-3个部分,需详细描述各占比;若超过5个部分,应合并占比小的部分(如“其他项占5%”),重点分析占比前3-4的主体。
- 时间动态:若为动态饼图(如不同年份的数据对比),需结合时间变化描述占比趋势(上升、下降、稳定)。
写作结构与段落分配
饼图作文建议采用“四段式”结构,逻辑清晰且易于控制字数(约150词):
第一段:图表概述(1-2句)
- 开篇点明图表类型及反映的核心主题,无需展开数据。
- 示例:“The pie charts illustrate the proportion of energy consumption sourced from different types in Country A in 2025 and 2030.”
第二段:主体数据描述(2-3段,每段3-4句)
- 原则1:按“从大到小”或“从主到次”顺序描述,避免罗列数据。
- 原则2:突出“最大/最小占比”“显著差异”“特殊变化”等关键特征。
- 结构:若为单一饼图,按占比分段描述;若为多个饼图(如对比图),分段描述同一指标在不同时间的变化,或对比不同主体的差异。
- 示例(单一饼图):“Coal accounted for the largest proportion of energy consumption, at 45%, followed by oil and natural gas, which constituted 30% and 15% respectively. Renewable energy, including solar and wind, made up the remaining 10%.”
第三段:归纳总结(1-2句)
- 总结图表反映的核心规律,如“化石能源仍占主导地位”“可再生能源占比逐年上升”等,避免重复数据。
- 示例:“It is clear that traditional non-renewable energies dominated the energy structure, while the share of clean energy remained relatively low.”
核心词汇与句式运用
占比描述词汇
- 主流表达:account for(占)、constitute(构成)、make up(占比)、comprise(包含)、represent(占比)
- 精确表达:comprise approximately/nearly/about 40%(占比约40%)、constituted a significant majority(占绝大多数)、accounted for just over a quarter(略超四分之一)
大小对比句式
- 倍数关系:“A was three times larger than B.”(A是B的三倍)
- 差异描述:“The proportion of A was significantly higher than that of B.”(A的占比显著高于B)
- 排序表达:“A ranked the first, followed by B and C.”(A居首位,其次是B和C)
趋势描述(动态饼图)
- 上升:“The percentage of A increased sharply from 20% to 35%.”(A的占比从20%急剧升至35%)
- 下降:“There was a slight decline in B’s share, dropping from 30% to 25%.”(B的占比略有下降,从30%降至25%)
- 稳定:“C remained relatively stable, accounting for around 15% throughout the period.”(C占比保持稳定,约为15%)
注意事项与避坑指南
- 避免主观臆断:仅描述图表数据,不添加个人观点(如“应该增加可再生能源”)。
- 数据取舍合理:若饼图有“其他(Others)”项,且占比<5%,可合并描述;若占比≥5%,需单独说明。
- 单位统一:确保百分比、数量等单位与图表一致,避免混淆(如“10 thousand”不等于“10%”)。
- 句式多样化:避免反复使用“account for”,可替换为“constitute”“make up”等;适当使用分词结构(如“Ranking second, oil contributed 30%”)提升句式丰富度。
实例解析(以“2025年与2030全球可再生能源占比”为例)
图表信息:2025年可再生能源占比:太阳能15%,风能20%,水能35%,其他30%;2030年预测:太阳能25%,风能30%,水能25%,其他20%。
参考范文
The pie charts compare the global share of renewable energy sources in 2025 and the predicted figures for 2030. Overall, while hydropower is expected to lose its dominant position, the combined proportion of solar and wind energy will see a noticeable increase.
In 2025, hydropower constituted the largest part of renewable energy, at 35%, followed by wind energy (20%) and solar energy (15%). The remaining 30% was categorized as others. By 2030, however, the distribution is predicted to change dramatically: wind energy and solar energy will grow to 30% and 25% respectively, overtaking hydropower, which is projected to decline to 25%. The share of others will also decrease to 20%.
It is clear that the renewable energy structure will shift from hydropower-dominated to a more balanced model, with solar and wind energy playing increasingly crucial roles.
相关问答FAQs
Q1:饼图作文中,如果所有数据占比都接近(如均为25%左右),如何展开描述?
A1:若数据占比接近,需重点描述“分布均匀”这一核心特征,并避免强行排序,可先总结“各部分占比差异较小”,再列举具体数据(如“A、B、C、D四类占比分别为26%、25%、24%、25%”),最后补充说明“无明显主导类别”。“The four categories accounted for almost equal proportions, ranging from 24% to 26%, indicating a relatively balanced distribution.”
Q2:动态饼图对比两个时间点的数据时,是否需要描述每个时间点的所有数据?
A2:不需要,应优先描述“变化显著”的数据(如上升/下降超过5%的部分),对于稳定或变化微小的数据(如占比±2%以内)可合并说明。“While the proportion of A increased from 30% to 40%, B remained relatively stable at around 20%, and C decreased slightly from 25% to 23%.” 这样既能突出重点,又能避免冗余。